Which U.S. Host City Gives You the Most Home for Your Money?
With the 2026 FIFA World Cup™ bringing in millions of soccer fans and international visitors to the United States, the spotlight isn’t just on the pitches—it’s also shining bright on the housing markets surrounding the stadiums.
Whether you’re looking to relocate, purchase your first home, invest in rental property, or you’re simply curious about how these iconic metros stack up, we analyzed all 11 U.S. World Cup host cities. By tracking the key real estate metrics that matter most to today’s buyers, we built the ultimate 2026 World Cup Host Cities Housing Index to determine which markets offer the absolute best value.
The 11 U.S. Host Cities Compared
Matches are being played across the country in these distinct metropolitan hubs:
- Atlanta, Georgia
- Boston, Massachusetts
- Dallas, Texas
- Houston, Texas
- Kansas City, Missouri
- Los Angeles, California
- Miami, Florida
- New York / New Jersey Metro
- Philadelphia, Pennsylvania
- San Francisco Bay Area, California
- Seattle, Washington
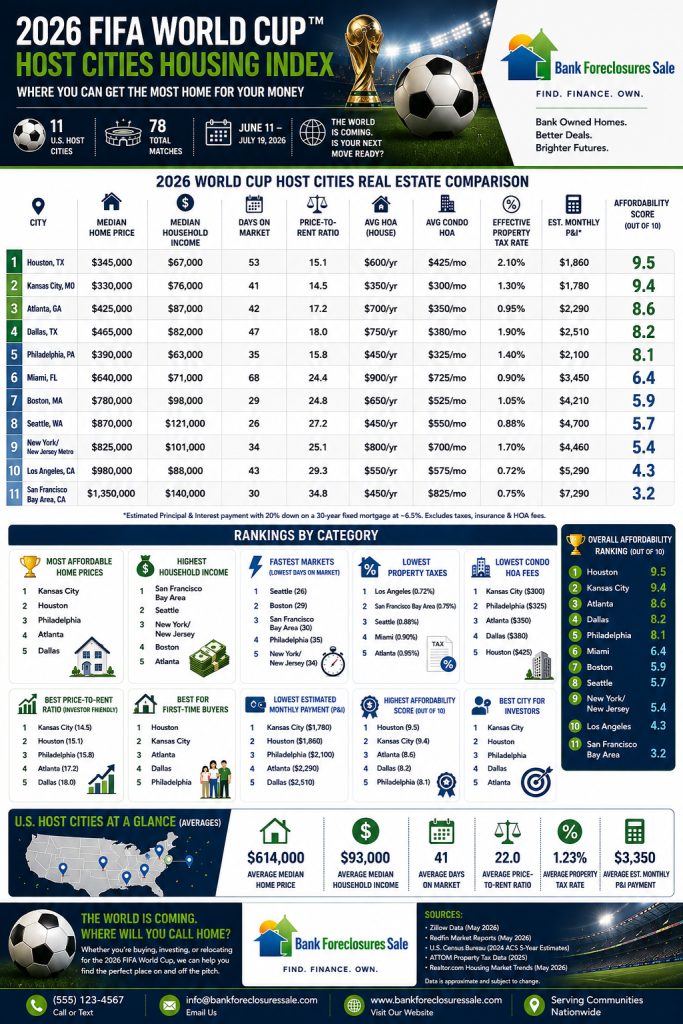
While every city offers world-class amenities, their local real estate dynamics are worlds apart. Across all host cities, the average median home price sits at $614,000, supported by an average median household income of $93,000. On average, listings spend 41 days on market, featuring a 22.0 price-to-rent ratio and an effective property tax rate of 1.23%.
How We Ranked the Markets
Rather than just looking at sticker-price home values, we weighed multiple financial layers that dictate real-world affordability and long-term investment viability:
- Median Home Price: The baseline purchase price buyers can expect.
- Median Household Income: Balancing local earning power against housing costs.
- Days on Market: A clear snapshot of local inventory speed and buyer competition.
- Price-to-Rent Ratio: The crucial metric for investors determining if buying beats renting.
- HOA & Condo Fees: The ongoing monthly and annual carrying costs that sneakily impact buying power.
- Property Tax Rates: Local tax structures that can heavily shift your total monthly mortgage payment.
- Estimated Monthly P&I: Calculated using a standard 30-year fixed mortgage at ~6.5% with a 20% down payment.
The Biggest Market Takeaways
🏆 Houston Leads the Pack (Affordability Score: 9.5/10)
Houston claims the #1 spot as the most affordable World Cup host city. With a highly accessible median home price of $345,000 and a strong investor-friendly price-to-rent ratio of 15.1, it offers incredible value. While its effective property tax rate is the highest on the list at 2.10%, the low barrier to entry keeps the estimated monthly P&I at an affordable $1,860.
🥈 Kansas City Continues to Impress (Affordability Score: 9.4/10)
Finishing a hair behind Houston, Kansas City is a haven for first-time buyers and sharp investors. It boasts the lowest median home price on the index at $330,000, paired with a fantastic 14.5 price-to-rent ratio and modest $350/year HOA fees.
🥉 Atlanta Offers a Strong Balance (Affordability Score: 8.6/10)
Securing the third spot, Atlanta balances a booming job market with an attainable $425,000 median home price. Backed by a gentle 0.95% property tax rate, it remains a premier destination for buyers hunting for a blend of appreciation potential and daily affordability.
📉 California Markets Command Premium Prices
Unsurprisingly, Los Angeles (Score: 4.3) and the San Francisco Bay Area (Score: 3.2) sit at the bottom of our affordability index. While they offer some of the lowest effective property tax rates in the country (0.72% and 0.75% respectively), median home prices—ranging from $980,000 up to a staggering $1,350,000—create steep barriers to entry. An estimated monthly P&I of $7,290 in the Bay Area highlights the premium premium paid for California real estate.
⚡ Seattle and Boston Move at Lightning Speed
If you are looking to buy in Seattle or Boston, you have to move fast. Seattle features the lowest days on market at just 26 days, closely followed by Boston at 29 days. High median household incomes ($121,000 in Seattle; $98,000 in Boston) fuel intense competition for limited inventory.
Index Leaders by Category
🏠 Top 5 Most Affordable Median Home Prices
- Kansas City, MO: $330,000
- Houston, TX: $345,000
- Philadelphia, PA: $390,000
- Atlanta, GA: $425,000
- Dallas, TX: $465,000
💰 Top 5 Highest Median Household Incomes
- San Francisco Bay Area, CA: $140,000
- Seattle, WA: $121,000
- New York / New Jersey Metro: $101,000
- Boston, MA: $98,000
- Atlanta, GA: $87,000
💸 Top 5 Lowest Property Tax Rates
- Los Angeles, CA: 0.72%
- San Francisco Bay Area, CA: 0.75%
- Seattle, WA: 0.88%
- Miami, FL: 0.90%
- Atlanta, GA: 0.95%
📊 Comprehensive 2026 Affordability Ranking (Out of 10)
- Houston, TX (9.5)
- Kansas City, MO (9.4)
- Atlanta, GA (8.6)
- Dallas, TX (8.2)
- Philadelphia, PA (8.1)
- Miami, FL (6.4)
- Boston, MA (5.9)
- Seattle, WA (5.7)
- New York / New Jersey Metro (5.4)
- Los Angeles, CA (4.3)
- San Francisco Bay Area, CA (3.2)
Why This Matters to Buyers and Investors
Global sporting events put an undeniable spotlight on their host cities, but local underlying real estate fundamentals dictate whether a market is a safe place to invest or buy.
Varying job structures, tax rates, inventory constraints, and hidden costs (like HOA/condo fees) mean that two cities with identical home prices could have radically different monthly carrying costs. Digging past the surface level helps you avoid overpaying and reveals hidden real estate opportunities.
View the Full Index Breakdown
Want to view the entire side-by-side data sheet? Scroll up to check out our complete 2026 FIFA World Cup™ Host Cities Housing Index infographic. From individual city condo fee averages to specific price-to-rent breakdowns, it has everything you need to make an informed, data-backed property decision.
If you are ready to explore equity-building opportunities, check out our latest curated real estate listings to find your next investment property or home.